
The Fourth Turning: Why History Moves in Cycles, Not Straight Lines
I’ve been watching markets and collecting coins since 1976 — fifty years now — and one thing that’s stuck with me is how much history seems to move in patterns, not as a straight line of progress. There’s a framework for this that a lot of people find useful: The Fourth Turning.
What The Fourth Turning Actually Says
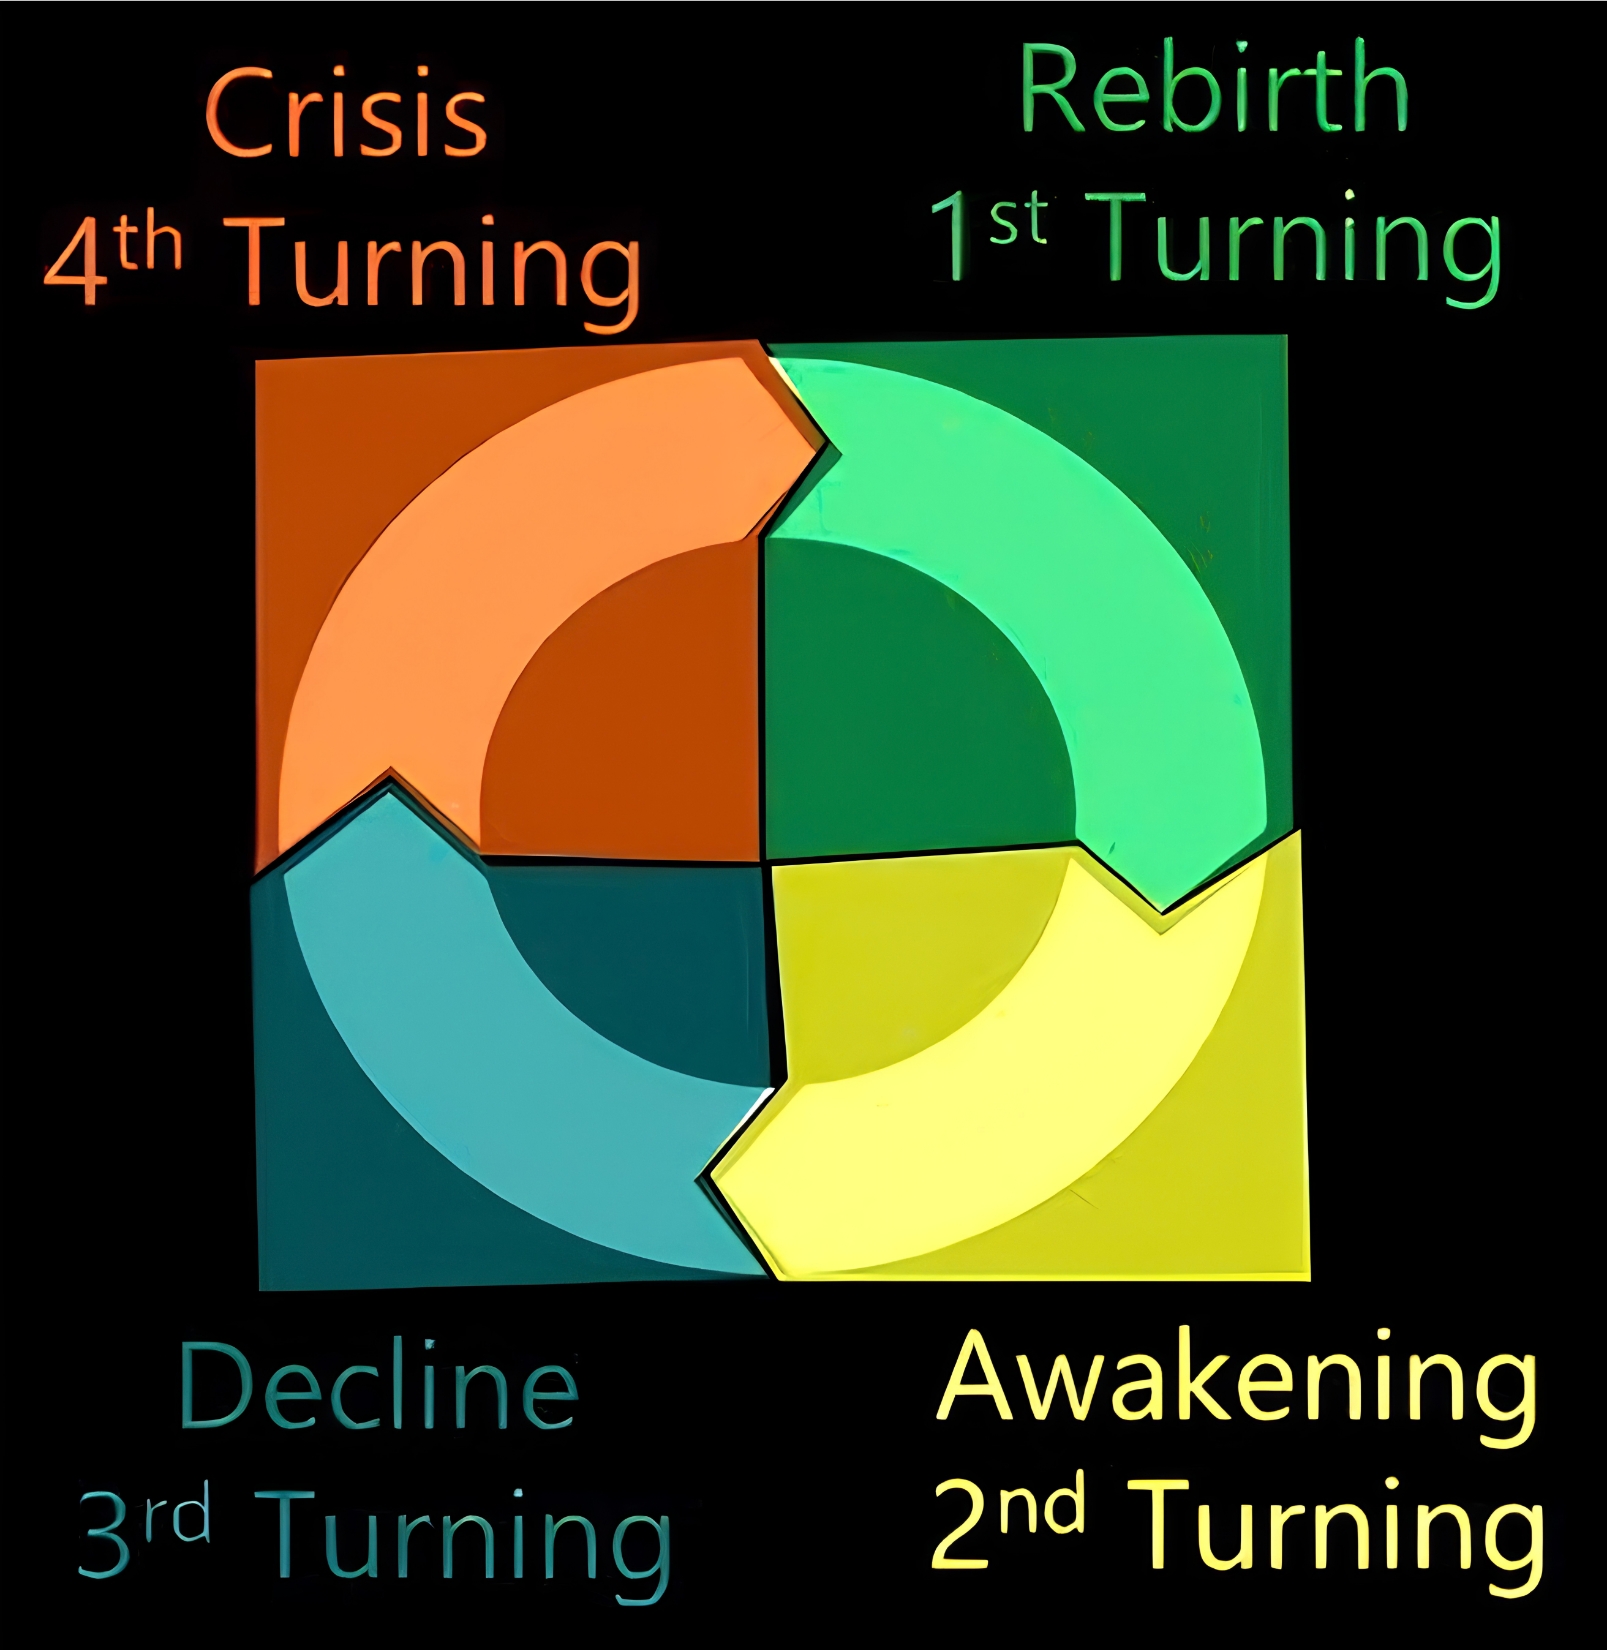
Historians William Strauss and Neil Howe proposed — in a 1997 book, with a 2023 follow-up — that American history moves through a recurring cycle of roughly 80 to 100 years, made up of four “turnings”: a High, an Awakening, an Unraveling, and a Crisis, each lasting about 20 years, roughly the length of a generation. It’s a framework many see playing out, not a settled prediction.
Why You Can’t Feel the Cycle From Inside It
A full turning is longer than most people’s lived adult experience of paying close attention to it — which is exactly why the pattern isn’t obvious to most people living through any one part of it. You’d need to be watching for the better part of a lifetime to see the shape of the whole thing, the way you might only recognize a season after you’ve lived through many of them.
Where We Might Be Now
Many who follow this framework see the period since roughly the 2008 financial crisis as consistent with a “Crisis” turning — a period marked by institutional stress and major realignment. I’m not a prophet, and I don’t present this as certain — it’s a lens, not a forecast.
Here’s how I connect the dots between Fourth Turning theory and precious metals. In Strauss and Howe’s framework, a Fourth Turning is what happens when the old order frays under decades of accumulated debt — financial, social, and political — and people start looking for stores of value that sit outside fiat currency and the institutions that control it. We’ve been through this before. The Depression and World War II, the Civil War, even the Revolution — each one brought monetary upheaval, inflation or debt crises, war financing, and eventually a reset that favored hard assets. Gold and silver kept showing up as the hedge of choice in those periods, and I think it’s because they’re scarce, recognized everywhere, and don’t depend on any government’s promise to pay.
Look at where we sit today and a lot of those same ingredients are back on the table: high sovereign debt, the lingering effects of the monetary expansion after 2008 and again after COVID, real friction between the great powers — Russia and Ukraine, tension with China, flashpoints in the Middle East — on top of the polarization and eroding trust most people feel without needing me to point it out. All of that tends to push people toward monetary metals as insurance against the next shock. I’d also point to the fragmentation showing up at the national level: Alberta’s October 2026 referendum process on separating from Canada, the ongoing conversation in Quebec (though the timing there seems tied to U.S. politics), the push in Scotland, Wales, and Northern Ireland for constitutional change, and what we saw earlier out of Catalonia. Strauss and Howe wrote about exactly this kind of questioning of nation and empire when central institutions lose their legitimacy, and I think it adds to the uncertainty that sends money looking for a safe harbor in gold and silver.
Why Gold and Silver Perform Well During a Fourth Turning Crisis
In past Fourth Turnings, monetary metals held their value against paper claims when things got uncertain, inflation ran hot, or the system needed a reset — you can see it in gold’s role after Bretton Woods and under the older commodity standards. Today we’ve got a similar set of ingredients: the risk of further fiat currency devaluation, central banks in a number of countries adding to their gold reserves, real industrial demand for silver from solar, electronics, and EVs, and supply risk tied to geopolitics. All of that reinforces the case for holding gold and silver as a hedge against inflation and currency risk. Silver behaves a little differently because it’s both a monetary metal and an industrial one, so it tends to swing harder in both directions. None of this hands you an exact price — what the Fourth Turning framework really describes is a mood: distrust, hardship, and pressure toward renewal — and it’s in that kind of mood that the case for meaningfully higher nominal gold and silver prices becomes a lot more plausible.
Gold and Silver Price Predictions: Fibonacci and Elliott Wave Targets Through 2041
For the technically inclined, there’s a way to put some numbers around this. Analysts who work with Fibonacci ratios — 0.618, the 1.618 “golden ratio,” 2.618, 4.236 — and Elliott Wave counts like to lay them over multi-decade charts measured from the major cyclical lows: the late-1990s and 2000s bottoms and the 2015 low for gold, similar long-term bases for silver. I want to be clear these are probability frameworks, not guarantees — markets overshoot, fail to reach a target, or just take longer than expected. But long-term impulse waves, especially an extended Wave 3 or Wave 5 inside a secular bull market, tend to reach for those extension levels, and that tendency gets stronger if inflation or currency debasement picks up speed.
As of mid-September 2026, spot gold is trading around $4,300 to $4,400 an ounce — it’s been in the $4,340 to $4,380 range lately, after touching highs above $5,300 earlier this year in some data — and silver is sitting near $65 to $66 an ounce, having pulled back from highs closer to $115 to $122 earlier in the year. Both are well above where they sat back in the 2015 to 2020 range, which fits with the idea that we’re in the middle of a multi-year gold and silver bull market rather than at the end of one.
Putting the Fibonacci and Elliott Wave work together with where prices are now, here’s the kind of long-term gold price prediction some analysts point toward, and the figures I’ve been asked to lay out here. Around 2028, a move into the $5,500 to $6,000 zone, which lines up with the 100 to 127 percent extensions off the recent consolidation and matches some of the technical windows the big banks are watching. By around 2031, $7,000 to $8,000, tied to the 1.618 extension of this secular advance. And out toward 2036 to 2041, $10,000 to $12,500 or more, tied to the higher-degree 2.618 or 4.236 extensions if a Wave 5 plays out against a backdrop of sustained monetary stress or worse. Some of the older wave counts, measured from even earlier lows, point higher still under a full systemic-reset scenario, though I’d treat those as outlier tails rather than a base case.
Silver’s numbers are wider, because that’s just how silver behaves. Around 2028, I’d watch $85 to $110, which clears the overhead resistance and retests the old highs through the 78.6 to 100 percent macro levels. By 2031, something like $135 to $220, driven by the 1.618 extension of the current breakout leg plus the physical deficit story that keeps coming up — some bank models, using a compressed gold-to-silver ratio, put triple digits well within reach. And out to 2036 through 2041, $300 to $500 or more, mapping the 2.618 to 4.236 extensions and echoing what happened in the squeezes of 1980 and 2011. Silver’s higher beta just means bigger, faster moves in both directions — one more reason I tell people silver is the more volatile half of a gold and silver hedge.
All of this assumes the secular bull market keeps running inside a Crisis-era backdrop, and the time frames roughly line up with when Howe’s updated work expects this Fourth Turning to resolve — sometime in the early-to-mid 2030s. The geopolitical and separatist pressures I mentioned earlier act as accelerants on top of all this: they raise uncertainty, push people to diversify away from purely fiat-denominated assets, and can tighten supply or boost demand at the same time. They don’t cause a rally in gold and silver by themselves, but they add to the risk premium that supports one. Where we actually end up depends on how policymakers respond, what happens with growth and inflation, and whether we come out the other side with a credible new order or a longer stretch of disorder.
So here’s where I land. I think the Fourth Turning lens makes a solid case for gold and silver as the assets to hold through a Crisis era, and the technical upside — the Fibonacci extensions on these long-term wave counts — starts to look a lot more credible once you factor in the very stresses the theory describes: debt, conflict, fragmentation, and eroding trust. The multi-year targets I’ve laid out here — $8,000 to $10,000-plus for gold, $150 to $300-plus for silver — represent one coherent set of extension levels, consistent with an aggressive but historically-grounded bull market playing out under a lot of uncertainty. I’m not a prophet, and markets don’t move in straight lines — these are frameworks for thinking through scenarios, not promises about where prices will land. If you’d like to talk through how this kind of thinking might apply to building a gold and silver position or selling coins and bullion you already hold, that’s a conversation I’m always happy to have — no pressure, no sales pitch, just two people talking about metals.
The Practical Takeaway
Whatever you make of the framework, the practical lesson holds regardless: financial history moves in cycles. Historically, every time the U.S. has run deficits at this level, gold has tended to outperform the dollar within about five years. That’s not a prediction of what’s about to happen — it’s a historical pattern worth knowing, from someone who’s been watching it a while.
Closing
I’m sharing this because fifty years gives you a certain kind of perspective — not certainty, just accumulated pattern recognition. Make of it what you will.
Leave a Reply